Digital inclusion stocktake: What digital inclusion looks like across government
Executive summary
The vision behind the Digital Inclusion Blueprint — Te Mahere mō te Whakaurunga Matihiko, is that all of us have what we need to participate in, contribute to, and benefit from the digital world. This report describes the current landscape of digital inclusion initiatives across government. It highlights what is happening across government and where opportunities are for future work.
Digital inclusion initiatives can be defined as activities which contribute to enabling everyone to conveniently and confidently use digital devices and the internet. This stocktake was conducted by survey and is 1 output of the Digital Inclusion Action Plan, which focuses on building a strong foundation for digital inclusion and bring visibility to the work already underway. Throughout this report, comparisons are made to a stocktake of community initiatives, which was also an output of the Action Plan.
The large scope of initiatives shows the variation in agencies’ approaches to addressing digital inclusion. Despite the range of methods, patterns emerged regarding the outcomes the initiatives seek to achieve. The stocktake revealed 4 key outcome themes: measurement, customer support, engagement and development.
The Digital Inclusion Blueprint describes 4 elements of digital inclusion: motivation, access, skills and trust. All 4 elements are needed for a person to be digitally included.
Most initiatives are addressing access. Approximately 41% of government initiatives address 1 or more aspects of access, including connectivity, affordability and accessibility. Access also emerged as the most frequently addressed digital inclusion element in the community initiative stocktake.
More than one third of initiatives address the trust element. This suggests that online safety, digital understanding, and confidence and resilience are priority areas across government. Skills and motivation are the least addressed elements, with only 12% and 8% of initiatives addressing these, respectively. However, this may be because some skills focused agencies did not respond.
Some key findings in terms of the initiatives' longevity, scope and size include:
- Almost half of the initiatives are expected to carry on. Of the initiatives that were recently made inactive, the main reason was insufficient resources.
- Most of the initiatives are collaborative. Of these, 55% collaborate with partners from multiple sectors (that is, non-governmental organisations [NGOs], private).
- Approximately half of the agencies that responded are working on new ideas or potential pieces of work that may impact digital inclusion, including digital inclusion pilots and increasing target group integration into science, technology, engineering and mathematics areas.
Some key demographic findings include:
- Many initiatives do not target a specific group. This is consistent with findings from the community initiative stocktake. Of those which do, Māori are 1 of the most frequently targeted.
- The majority of initiatives are nationwide and are not specific to rural or urban areas. This is consistent with the community initiative stocktake.
- Almost half of the initiatives have incorporated some aspect of Te Ao Māori. Some of the main themes include engagement with iwi, translation into te reo Māori, Māori data sovereignty and co-design.
Stocktake results indicate that there is clear opportunity and appetite for more digital inclusion work in the future. Key questions to inform this include:
- The government and community stocktakes show motivation is the least addressed digital inclusion element. How can government agencies and other partners develop a more targeted approach to address motivation?
- Could pilot initiatives be used more frequently for digital inclusion investment?
- Some previous initiatives did not have sufficient resources. Could collaboration to pool funding and resources with other agencies and partners help to reduce this? Many agencies have already indicated that they would like to collaborate more.
- Could less frequently addressed groups be potential areas for future digital inclusion investment?
- Should initiatives continue to be implemented on a nationwide scale or could region-specific initiatives be more effective?
- How can we understand more about the Te Ao Māori perspective of digital inclusion?
Introduction
Purpose
The purpose of this report is to understand the current landscape of digital inclusion initiatives across government. It highlights what is already in place to address digital inclusion. In combination with the community initiative stocktake, it aims to inform the current landscape of digital inclusion in New Zealand. Having a clearer picture of the current landscape will allow better policy-making and support for digital inclusion in the future.
What does digital inclusion mean?
The Digital Inclusion Blueprint — Te Mahere mō te Whakaurunga Matihiko (the Blueprint) defines digital inclusion as “an end-state where everyone has equitable opportunities to participate in society using digital technologies (Digital Inclusion Research Group, 2017).”
As digital technologies weave their way into our lives, they impact society and the way we do things. It is therefore vital that everyone can participate fully in, and make the most of, our increasingly digital world. This is digital inclusion. To make the greatest impact, we need a clear, cohesive understanding of what digital inclusion looks like. We also need to set key priorities and know where the gaps are, so investment can be directed to where it’s most needed. Without coordination and visibility of what’s already happening, it is hard to identify gaps and see how the puzzle fits together.
Methodology
The stocktake was conducted by survey. We asked government agencies to report on any activities which contribute to enabling everyone to conveniently and confidently use digital devices and the internet. We did not receive responses from all agencies. Therefore, the stocktake is intended to be indicative and is not an exhaustive list.
For further information, refer to Appendix A: Methodology and methods.
Report outline
This report begins by discussing the context of the initiatives, including which agencies are involved, key outcomes, which digital inclusion elements are targeted, agency collaboration, and funding. The report also covers target demographics, followed by a section on Te Ao Māori. The next section explores monitoring and evaluation of the initiatives. The closing sections explore long-term impacts and next steps, followed by a discussion section.
1. Initiative context
This section provides context on initiatives which increase digital inclusion in New Zealand. It explores the landscape of digital inclusion across government, including which agencies are involved, initiative outcomes, digital inclusion elements, initiative length, collaboration and funding sources.
The Blueprint outlines 4 interdependent elements of digital inclusion: motivation, access, skills and trust.
What did the stocktake show?
The stocktake collected information on 74 digital inclusion initiatives across 20 government agencies. The large scope of initiatives represents the variation in methods for addressing digital inclusion.
The majority of initiatives serve a connect and coordinate role
The Blueprint sets out the roles that the government will play in the journey towards digital inclusion: lead, connect, support, and deliver. In graph 1, we have identified these roles within the digital inclusion initiatives across government agencies.
Graph 1 shows that:
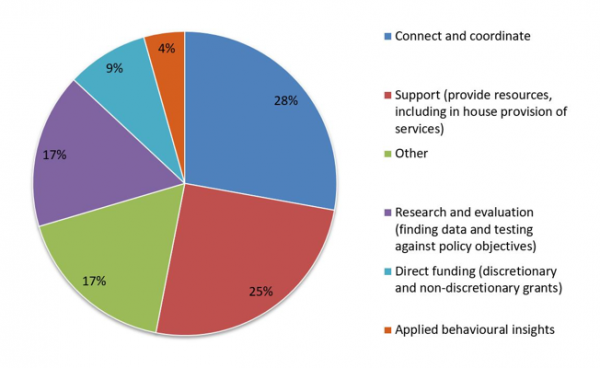
- across the majority of initiatives, government agencies were performing a connect and coordinate role (28%)
- approximately one quarter of agency initiatives were serving a support role (provide resources, including in-house provision of services)
- for 17% of initiatives, the primary purpose was to deliver research and evaluation
- smaller roles were applied behavioural insights (4%) and direct funding (discretionary and non-discretionary grants) (9%)
- Other was 17%.
Graph 1: Types of initiatives across government
Read detailed description of graph 1
This graph presents a pie chart that shows the percentage of types of initiatives across government. The chart shows:
- 28% of government initiatives were serving a connect and coordinate role
- 25% of government initiatives were serving a support role (provide resources, including inhouse provision of services)
- 17% of government initiatives were serving a research and evaluation role (finding data and testing against policy objectives)
- 17% of government initiatives were serving an other role
- 9% of government initiatives were serving a direct funding role (discretionary and non-discretionary grants)
- 4% of government initiatives were serving an applied behavioural insights role.
What outcomes are the initiatives aiming to achieve?
Agencies provided information about their ideal digital inclusion outcomes. We identified 4 potential themes. However, these themes need further investigation.
- Measurement — clear measurement to create a baseline of digital variables, for example, schools and digital technology.
- Customer support — improve customer experience, for example, access to and awareness of services.
- Engagement — facilitating connections between target groups and digital technology, for example, youth.
- Development — skills development opportunities, for example, investing in youth with business potential.
Other themes that emerged include:
- Reduction of inequalities — closing the digital divide for school age students.
- Safe sharing of data — trust and confidence in sharing data.
Which digital inclusion elements are being addressed?
Graph 2 shows the percentage of government digital inclusion initiatives that address the digital inclusion elements.
Access is most frequently addressed
Approximately 41% of government initiatives address 1 or more aspects of access, including connectivity, affordability and accessibility. Of these:
- approximately half of all access initiatives address accessibility
- approximately one third of access initiatives address connectivity.
Examples of access initiatives include Network for Learning’s Managed Network and the Ministry of Health's Zero-Rated Data Pilot.
Trust is also frequently addressed
More than one third of government initiatives address the trust element. This suggests that online safety, digital understanding, and confidence and resilience are priority areas across government.
Examples of trust initiatives include CERT NZ’s ‘Get Cyber Smart’ and the Department of Internal Affairs’ ‘Algorithm Assessment and System Setting’.
A small amount of initiatives address skills
Only 8% of initiatives address the skills element of digital inclusion. This may be because some skills-focused agencies did not respond.
Examples of skills-based initiatives include the Ministry of Social Development’s (MSD's) ‘Web Usability and Accessibility Standards’ and the National Library of New Zealand’s Professional Learning and Development.
Motivation is the least addressed digital inclusion element
Very few initiatives, approximately 9%, address the motivation element of digital inclusion. Examples of motivation initiatives include the Ministry of Health’s SPARX, which helps young people with mild to moderate depression, and the MSD's ‘Digital Capability’, which seeks to achieve improved client awareness of MSD’s services.
Graph 2: Government initiatives that address digital inclusion elements

Read detailed description of graph 2
This graph presents a pie chart that shows the percentage of government digital inclusion initiatives that address the digital inclusion elements. The chart shows:
- 41% of government initiatives address access
- 35% of government initiatives address trust
- 12% of government initiatives address skills*
- 9% of government initiatives address motivation
- 3% of government initiatives address other areas.
* Note: There was no response from several skills-focused agencies.
Measurement emerged as another potential focus element for digital inclusion
A small number of initiatives address concepts outside of the 4 elements outlined in the Blueprint. Initiatives under the ‘other’ element can predominately be categorised as measurement for research and evaluation purposes. These initiatives are aimed at shaping the system and are relevant because they will help to develop the digital inclusion knowledge base. An example of this is Statistics New Zealand’s (Stats NZ’s) ‘Improving measures of digital inclusion in Price Statistics’ initiative.
Digital inclusion elements are interdependent
Over half of the initiatives target more than 1 element. Although certain outcomes appear to correlate with certain elements, there is overlap.
Six initiatives address all 4 elements. These initiatives are spread across government:
- Equitable Digital Access — Ministry of Education
- Pasifika TechWeek 2019 — Ministry for Pacific Peoples
- Data Readiness Strategy — Ministry of Business, Innovation and Employment (MBIE)
- Data Protection and Use Policy – Social Investment Agency
- Ko Awatea Learn — Waikato District Health Board
- Topic Explorer — National Library of New Zealand, Department of Internal Affairs.
How does this compare to the community initiative stocktake and literature review?
Graph 3 shows the percentage of community digital inclusion initiatives that address the digital inclusion elements.
- Access also emerged as the most frequently addressed digital inclusion element in the community initiative stocktake. The digital inclusion literature review also found that access is the most researched area of digital inclusion in New Zealand.
- Skills is the second-most addressed element across community initiatives. Approximately 38% of community initiatives address skills, compared with 12% of government initiatives.
- Trust is 1 of the least frequently addressed elements across community initiatives (4%), compared with the higher frequency across government (35%).
- Community initiatives do not frequently address motivation. This is consistent with the government initiative stocktake.
Note that methodology differences could impact the data. The stocktake of government initiatives asked respondents to self-identify applicable digital inclusion elements. Conversely, elements were assigned for the community initiative stocktake.
Graph 3: Community initiatives that address digital inclusion elements

Read detailed description of graph 3
This graph presents a pie chart that shows the percentage of community digital inclusion initiatives that address the digital inclusion elements. The chart shows:
- 54% of community initiatives address access
- 38% of community initiatives address skills
- 4% of community initiatives address trust
- 4% of community initiatives address motivation.
Initiative length
Almost half the initiatives are expected to be continuing
- Approximately 38 of the initiatives are continuing or have no expected end date. This indicates a long-term commitment to digital inclusion across government agencies.
- Of those with an established end date, the average initiative length is 3.3 years.
- Most initiatives do not appear to be pilots.
- Only 1 agency reported a one-off initiative. The Ministry for Pacific People’s Pasifika TechWeek is expected to be a 1-day event scheduled in 2019.
- Very few agencies reported initiatives that had recently, within the past 2 years, become inactive.
- Of the initiatives that were recently made inactive, the main reason for this was insufficient resources.
13 initiatives started in the past year
Thirteen initiatives were implemented in the past year, 2018/2019, including:
- Data Protection and Use Policy — Social Investment Agency
- Accessibility Charter Across State Sector — Ministry of Social Development
- Iwi Data Trial — Stats NZ
- Digital Rights — Department of Internal Affairs.
Additionally, 2 initiatives are due to be implemented later in 2019: Inland Revenue’s ‘Collecting GST on low-value imported goods’ and the Ministry for Pacific People’s ‘Pasifika TechWeek 2019’.
Most of the initiatives which started in the past year address the access element of digital inclusion. However, the other elements are also addressed albeit to a lesser degree.
Of the currently active initiatives, a large proportion started in 2017. Similar to the 2018/2019 period, 2017 initiatives frequently target the access element. However, initiatives that started in 2017 also targeted trust at the same frequency.
A large proportion of initiatives are older than 9 years. The oldest initiatives, the Ministry of Education’s ‘Trends in International Mathematics and Science’, and the National Library of New Zealand’s ‘Professional Learning and Development’ have been active for approximately 20 years. Other long running government initiatives include MBIE’s ‘Telecommunications Relay Service’, which was implemented in 2004, and the National Library of New Zealand’s ‘Aotearoa People’s Network Kaharoa’, which was established in 2007.
Initiative collaboration
Most of the initiatives were collaborative
Graph 4 shows the percentage of groups that government initiatives are collaborating with.
- Approximately 72% of initiatives reported as being collaborative.
- Of the collaborative initiatives:
- 36% of them collaborated with partners from multiple sectors (that is, NGOs, private)
- 83% collaborate with more than 1 agency or entity.
- Government collaborates the most with other government agencies (45%), followed by the private sector (21%).
- Other was 19%.
Graph 4: Groups government is collaborating with

Read detailed description of graph 4
This graph presents a pie chart that shows, out of the government initiatives that reported as being collaborative, the percentage of groups that these government initiatives are collaborating with. The chart shows:
- 29% of government initiatives collaborate with central government
- 21% of government initiatives collaborate with the private sector
- 19% of government initiatives collaborate with other groups
- 16% of government initiatives collaborate with local government
- 15% of government initiatives collaborate with NGOs.
Government agencies led most of the reported projects
- Government agencies took the lead in most projects (68%).
- Some of the reasons for agencies not taking the lead in collaborative projects include:
- being part of an international organisation (such as the Organisation for Economic Co-operation and Development [OECD])
- promoting and supporting the initiative
- monitoring the initiative
- funding the initiative
- providing consultation.
Many respondents indicated who they would like to work with in the future
Graph 5 shows which groups government agencies would like to collaborate with.
- Approximately 72% of respondents named an entity or sector they would like to work with.
- Of all the projects, most wanted to work with central government more (39%). And 13% wanted to work with local government.
- 19% of government agencies would like to collaborate with NGOs, and 16% with the private sector.
- Other was 13%.
Graph 5: Groups government agencies would like to collaborate with

Read detailed description of graph 5
This graph presents a pie chart that shows the percentage of government agency respondents that would like to collaborate with specific groups. The chart shows:
- 39% of respondents would like to collaborate with central government
- 19% of respondents would like to collaborate with NGOs
- 16% of respondents would like to collaborate with the private sector
- 13% of respondents would like to collaborate with local government
- 13% of respondents would like to collaborate with other groups.
Initiative funding
Most agencies chose not to answer the funding questions. From those who did, we have the following anecdotes:
-
The majority of funding is departmental.
- Approximately 19% of initiatives are providing funding to external agencies.
2. Target demographics
The Blueprint identifies groups that are at risk of not being digitally included. This section examines which of these groups are being addressed by government digital inclusion initiatives and identifies which groups might need further support. This section also explores whether the initiatives are implemented on a nationwide scale or are region-specific.
The stocktake collected information about the following target groups:
- Māori
- Pacific peoples
- people with low housing stability
- people with low incomes
- people with low literacy levels
- people with mental health conditions
- people who choose not to go online
- people with disabilities
- senior leaders in the public and private sector
- unemployed people
- seniors
- women and/or girls
- migrants
- refugees with English as a second language
- offenders and ex-offenders
- small- and medium-sized enterprises
- youth.
Which groups are the initiatives targeting?
Graph 6 shows the number of government initiatives that are targeting specific groups.
Māori are 1 of the most frequently targeted groups for digital inclusion initiatives
Approximately one fifth of the initiatives do not target any specific group. This includes initiatives such as the National Library of New Zealand’s ‘Topic Explorer’ and ACC’s ‘Digital Self Service’.
Of the initiatives that do target specific groups, Māori are the most frequently targeted group with 14 initiatives directly targeting Māori. Examples of these initiatives are the National Library of New Zealand’s ‘Ngā Upoko Tukutuku Māori Subject Headings’ and the Ministry of Education’s ‘National Monitoring Study of Student Achievement’.
Other groups that were frequently targeted include:
- Pacific peoples
- seniors
- people with low incomes
- people with low literacy levels.
Ethnic communities
Five initiatives are specifically targeting ethnic communities. These initiatives are:
- Web Usability and Accessibility Standards — Ministry of Social Development
- Digital Assistance Strategy — Services and Access, Department of Internal Affairs
- Data Protection and Use Policy — Social Investment Agency
- Accessibility Charter Across State Sector — Ministry of Social Development
- EPIC — National Library of New Zealand, Department of Internal Affairs.
Some target groups received less support
The target groups that received less support are:
- People with disabilities
- Unemployed people
- Migrants
- Refugees with English as a second language
- Youth.
Some target groups received very little support
Very few initiatives, less than 5, target:
- women and/or girls
- people with low housing stability
- people with mental health conditions
- offenders and ex-offenders
- senior leaders in the public and private sector.
Additionally, very few initiatives target people who choose not to go online. This is consistent with the data on digital inclusion elements, which indicates motivation is the least targeted element. Of those who responded, no initiatives specifically target small- and medium-sized enterprises.
Graph 6: Frequency of government initiatives targeting specific groups

Read detailed description of graph 6
This graph shows the number of government digital inclusion initiatives (frequency) that target specific groups. The chart shows:
- approximately 34 or one fifth of the initiatives do not target any specific group
- 14 initiatives target Māori
- approximately 13 initiatives target other groups
- approximately 9 initiatives target Pacific peoples
- approximately 7 initiatives target seniors
- approximately 7 initiatives target people with low incomes
- approximately 6 initiatives target people with low literacy levels
- 5 initiatives target people with disabilities
- 5 initiatives target unemployed people
- 5 initiatives target migrants
- 5 initiatives target refugees with English as a second language
- 5 initiatives target youth
- less than 5 initiatives target women and/or girls
- less than 5 initiatives target people with low housing stability
- less than 5 initiatives target people with mental health conditions
- less than 5 initiatives target people who choose not to go online
- less than 5 initiatives target offenders and ex-offenders
- less than 5 initiatives target senior leaders in the public and private sectors
- no initiatives target small- and medium-sized enterprises.
Some initiatives address more than 1 target group
Approximately 16 of the government initiatives target more than 1 group. Of those, the following initiatives target the greatest number of groups.
- Web Usability and Accessibility Standards — Ministry of Social Development
- Data Protection and Use Policy — Social Investment Agency
- EPIC — National Library of New Zealand, Department of Internal Affairs.
Patterns emerged from initiatives that target multiple groups. For example, initiatives that targeted Māori also frequently targeted Pacific people. Other correlations of target groups include:
- low incomes and low literacy levels
- migrants and refugees
- unemployed and seniors.
How do these findings compare to the community initiative stocktake?
Graph 7 shows the percentage of community initiatives that targets specific groups. Like government initiatives, the majority of community initiatives (59%) do not target a specific group. However, of the initiatives that do target specific groups, ‘low income’ is the most frequently targeted (15%). The graph also shows:
- 11% of community initiatives target teachers
- 6% target organisations/schools
- 5% target people with disabilities
- 3% target Māori
- 1% target women and/or girls.
Graph 7: Community initiatives targeting specific groups

Read detailed description of graph 7
This graph presents a pie chart that shows the percentage of community digital inclusion initiatives that target specific groups. The chart shows:
- 59% of initiatives or programmes do not target any specific group
- 15% of initiatives target people with low incomes
- 11% of initiatives target teachers
- 6% of initiatives target organisations or schools
- 5% of initiatives target people with disabilities
- 3% of initiatives target Māori
- 1% of initiatives target women and/or girls.
Where have initiatives been implemented?
The majority of initiatives are nationwide and were not specific to rural or urban areas. Results from the community initiative stocktake were also consistent with this finding.
Several community initiatives targeted Auckland and Wellington regions. This indicates a possible correlation between the number of initiatives and density of population.
3. Te Ao Māori
Te Ao Māori is a priority for the Digital Inclusion Action Plan and is important for all of our work, not only in the digital space. This section explores how government agencies are incorporating a Te Ao Māori approach and fulfilling our obligations under the Treaty of Waitangi.
Work towards digital inclusion in Aotearoa needs to support the aspirations and culture of tāngata whenua in a digital world, both collectively and as individuals.
It is important to include the voice of people who are impacted when investigating how to address inequalities. As stated in section 2: Target demographics, Māori are one of the most frequently targeted groups for digital inclusion initiatives. How, then, has Te Ao Māori been incorporated into the development of these initiatives?
Almost half of the initiatives have incorporated some aspect of Te Ao Māori into their works. The main themes that have emerged are:
- engagement with Māori partners: iwi, Te Puni Kōkiri, Te Arawhiti (Māori Crown Relations), local Whānau Ora organisations and other areas in government, including Māori Data Governance with Stats NZ.
- translation into te reo Māori
- implementation in Māori medium schools
- Māori data sovereignty and data use
- internet access in marae
- co-design
- supporting disabled Māori.
Examples of initiatives which incorporate Te Ao Māori are:
- Ngā Upoko Tukutuku Māori Subject Headings — National Library of New Zealand, Department of Internal Affairs
- Digital Identity Transition Programmes — Department of Internal Affairs.
Incorporation of Te Ao Māori is important for understanding how Māori are affected by digital inclusion and the best ways to include Māori.
4. Monitoring and evaluation
Most initiatives are being evaluated
Graph 8 shows the percentage of reported government initiatives that have been evaluated, informally evaluated and not evaluated.
- 67% of the initiatives have been or will be evaluated.
- One of the reasons some agencies aren’t performing an evaluation on certain initiatives may be because they aren’t leading them. Some initiatives are being led by other agencies or organisations that would likely carry out an evaluation.
- Some agencies have decided to perform an informal evaluation of the projects they’re involved in (26%), although the majority are formal (41%).

Detailed description of graph
This graph presents a pie chart that shows the percentage of reported government digital inclusion initiatives that have been evaluated, informally evaluated and not evaluated. The chart shows:
- 41% of government initiatives have been evaluated
- 33% of government initiatives not been evaluated
- 26% of government initiatives have had an informal evaluation.
5. Additional information
Agencies have a long-term vision for digital inclusion
Agencies outlined their expectations for long-term impacts. Equitable access to digital content for all New Zealanders was the most common theme. This includes closing the digital divide for school age students, implementing digital learning opportunities, and improved access for people with disabilities.
Some of the other themes that emerged include:
- improved services to the community — MBIE’s ‘Telecommunications Relay Service’
- improved access to digital content — National Library of New Zealand’s ‘EPIC’
- educational equity — Ministry of Education’s ‘Equitable Digital Access’
- support for te reo Māori — National Library of New Zealand’s ‘Ngā Upoko Tukutuku Māori Subject Headings’.
Agencies reported success stories
Several agencies reported the success they have experienced in digital inclusion. These success stories include:
- Ministry of Social Development: Web Usability and Accessibility — raising awareness of the importance of accessibility
- National Library of New Zealand, Department of Internal Affairs: EPIC — school children have access to high quality digital material
- Network for Learning — blog of success stories.
6. Next steps and future innovation
Approximately half of the agencies who responded are working on new ideas or potential pieces of work that may impact digital inclusion.
Some agencies indicated that they are currently working on ideas or potential pieces of digital inclusion work separate to the current initiatives that they reported on.
The following agencies are currently working on ideas or potential pieces of work that may impact digital inclusion:
- Ministry of Social Development — multiple programmes of digital work, including identity work and accessibility changes
- Ministry of Education — OECD plans to discuss the ‘Learning in a digital world’ theme
- Network for Learning — digital inclusion pilots across the country
- MBIE — scoping the questions of broadband affordability
- Ministry for Pacific Peoples — increasing representation of Pasifika in science, technology, engineering and mathematics (STEM) areas
- New Zealand Trade and Enterprise (NZTE) — helping NZTE customers with all digital initiatives
- Department of Internal Affairs — digitisation on demand, digital rights and digital inclusion
- National Library of New Zealand — digital collections, assisting students to develop skills
- Archives New Zealand — digitisation on demand, instructional videos
- Accident Compensation Corporation — continued development of digital products
- Social Investment Agency — Data Protection and Use Policy
- Ministry of Health
- Waikato DHB — looking at different ways to deliver learning
- Bay of Plenty DHB — regional DHB collaboration.
These results are promising as they indicate that there is ongoing government-wide innovation happening in the digital inclusion space.
Some agencies have integrated digital inclusion into their business-as-usual activities
The majority of these activities appear to address the skills element of digital inclusion.
Examples of these services include:
- Archives New Zealand — staff help users to navigate and use digital systems
- Ministry of Social Development — front-of-house digital channel support and navigation
- Social Investment Agency — provide support to agencies or NGOs who are interested in using the data exchange
- National Library of New Zealand — show students how to find, assess and use digital resources, providing network and internet access to libraries across New Zealand, development of libraries as places and services supporting digital inclusion, training for partner library staff to increase their familiarity with digital tools
- Department of Internal Affairs — factsheet and guidance material on spam complaints
- Ministry of Health — quarterly reports of portal uptake by practices and patients
- Waikato DHB — facilitate drop-in sessions to assist with computer application queries
- Accident Compensation Corporation — staff on-boarding videos
These activities offer insights into alternative ways to address digital inclusion. To determine their effectiveness, more monitoring and evaluation of these business-as-usual activities is needed.
Many agencies indicated that they would like to do more in the digital inclusion space
Many agencies indicated that, if resource constraints were not an issue, they would like to do more in the digital inclusion space. Examples of these aspirations include:
- Ministry of Education — equitable digital access for all
- Network for Learning — interventions to increase household internet access, as well as better quality, more granular data to be able to assess the needs and the impact of these interventions.
- Ministry for Pacific Peoples — teach more advanced digital skills in communities, such as coding workshops
- National Library of New Zealand — increase APNK network coverage to more libraries and marae, make collections more visible and accessible, and create more, high-quality Te Ao Māori resources
- Accident Compensation Corporation — investigate coding for accessibility and provide better access to and understanding of accessibility tools, such as screen readers.
These suggestions indicate that there is clear appetite and opportunity for future innovation in the digital inclusion space.
7. Conclusion and key questions
Digital inclusion is vital to ensuring that everyone can participate fully in, and make the most of, our increasingly digital world. To make the greatest impact, we need a clear, cohesive understanding of what digital inclusion looks like. We also need to set key priorities and understand where gaps in digital inclusion initiatives are, so investment can be directed to where it’s most needed. Without coordination among all initiatives working towards digital inclusion and visibility of what’s already happening to realise this goal, it is hard to identify gaps and see how the puzzle fits together.
How can government agencies develop a more targeted investment approach to address motivation?
Access emerged as the most frequently addressed digital inclusion element across the government initiative stocktake and the community initiative stocktake.
More than one third of government initiatives address the trust element. This suggests that online safety and digital understanding, confidence and resilience are priority areas across government. However, trust was the least addressed element in the community initiative stocktake.
Skills was also an area of difference between the government and community stocktakes. Approximately 38% of community initiatives addressed skills, compared with 11% of government initiatives. These differences could be a result of different priorities or resources between the government and community sectors. However, this may also be due to the low response level from some skills-focused agencies.
Conversely, motivation consistently emerged as 1 of the least addressed elements of digital inclusion. The digital inclusion literature review confirmed that motivation has not been widely studied in New Zealand and that understanding motivation and trust are both areas New Zealand could improve on. This could be a result of motivation being more difficult to address in isolation than the more tangible elements of access and skills. If this is true, how can government agencies and other partners develop a more targeted investment approach to address motivation? Perhaps the interdependent nature of the digital inclusion elements could be used to this advantage. For example, initiatives which address skills and trust could indirectly increase motivation to use digital technologies.
Almost half of the initiatives are expected to be continuous. This suggests a long-term commitment to digital inclusion across government agencies. The data also indicates that most initiatives do not appear to be pilots. Could pilot initiatives be used more frequently for digital inclusion investment?
Could collaboration with other partners reduce resource shortages?
Some respondents indicated that their agencies had been involved with initiatives that were recently made inactive. The main reason cited for this was insufficient resources. How can government ensure investment or funding to reduce this? Could collaboration to pool funding and resources with other agencies and partners help to reduce this? Most of the current government initiatives are collaborative, with many respondents also indicating that they would like to work with other partners in the future.
Some agencies provided information on initiative funding. However, funding of digital inclusion initiatives remains relatively inconclusive. Future research should be conducted to clarify this uncertainty and evaluate how much funding is being invested into each of the 4 elements of digital inclusion.
Are less frequently addressed target groups areas for future investment?
The Blueprint states that in order to address the barriers to digital inclusion, it will be important to look at underlying systemic challenges and drivers as well as the more visible symptoms.
Government initiative stocktake findings were consistent with the community initiative stocktake; most digital inclusion initiatives do not target a specific group. Of those initiatives which did target specific groups, government initiatives most frequently targeted Māori while community initiatives most frequently targeted people with low incomes.
The government initiative stocktake also identified groups which are less frequently targeted and may need additional support. For example, very few initiatives target people who choose not to go online. This is consistent with the data on digital inclusion elements, which indicates motivation is the least targeted element.
Could these groups be potential areas for future digital inclusion investment? However, if certain groups were targeted over others, there would need to be clear intervention logic and rationale to support this.
Some government initiatives address multiple target groups. These initiatives could provide an opportunity to examine the potential benefits of targeting groups together. Additionally, there appears to be a correlation between the target group and the digital inclusion element addressed by initiatives. This correlation presents an opportunity for future initiatives to determine whether these groupings are effective. These concepts are outlined in the Blueprint, which highlights the importance of recognising that different approaches will be needed to address different barriers.
The government and community stocktakes were consistent in indicating that the majority of digital inclusion initiatives are implemented nationwide. This suggests that there is recognition across both the government and community sectors that the need for digital inclusion is a nationwide priority. However, there could be opportunities for future research to determine whether initiatives should continue to be implemented nationwide or whether initiatives targeted to specific regions are more effective.
There is opportunity to research the Te Ao Māori perspective of digital inclusion further
Work towards digital inclusion in Aotearoa New Zealand needs to support the aspirations and culture of tāngata whenua in a digital world, both collectively and as individuals. The government initiative stocktake indicates that almost half the initiatives have incorporated some aspect of Te Ao Māori. Some of the main themes to have emerged include engagement with iwi, translation into te reo Māori, Māori data sovereignty and co-design.
However, the literature review has indicated Te Ao Māori has had the least amount of attention in digital inclusion studies. There have been few studies that have looked at the Te Ao Māori perspective of digital inclusion. This is a significant gap because it is important that we understand how Māori are affected by digital inclusion and what are the best ways to include Māori. There is a huge opportunity to research the Te Ao Māori perspective of digital inclusion further.
Discrepancies in evaluation could offer an opportunity for future research
The government initiative stocktake indicates that most digital inclusion initiatives are being evaluated. However, 33% of agencies that answered said they had no plans to conduct an evaluation. These discrepancies in evaluation could offer an opportunity for future research to determine what the barriers to evaluation are.
There is innovation in the digital inclusion space
Approximately half of the agencies who responded are working on new ideas or potential pieces of work that may impact digital inclusion. These results are promising as they indicate that there is government-wide innovation happening in the digital inclusion space. Some themes that emerged include digital inclusion pilots and increasing Pasifika in STEM areas (science, technology, engineering and maths school subjects).
Some government agencies also indicated that they have integrated digital inclusion into their business-as-usual activities. The majority of these appear to address the skills element of digital inclusion. These activities were less likely to be evaluated, perhaps because of their nature as business-as-usual, as opposed to specific initiatives. However, these activities do offer an interesting opportunity to address digital inclusion. To determine their effectiveness, more monitoring and evaluation of these business-as-usual activities needs to be developed.
There is opportunity and desire for future innovation
Many agencies indicated that, if they had the resources, they would like to do more in the digital inclusion space. This suggests that there is clear opportunity and appetite for more digital inclusion work across government agencies and the Government Digital Services portfolio.
Appendix A: Methodology and methods
A digital inclusion survey was sent to 55 government agencies. We asked government agencies to report on any activities which contribute to enabling everyone to conveniently and confidently use digital devices and the internet. The scope of the survey included any initiative or business-as-usual activity which, directly or indirectly, contributed to digital inclusion. The survey did not include digital initiatives which addressed more advanced digital skills, such as coding.
We received responses from 20 agencies, which provided information on 74 digital inclusion initiatives. We acknowledge that there are limitations to this data. Some agencies did not respond and we were unable to get coverage in some areas. Therefore, this stocktake is intended to be indicative and is not an exhaustive list of digital inclusion initiatives across government agencies.
Agencies who responded were:
- Accident Compensation Corporation
- Ministry of Business, Innovation and Employment (MBIE)
- Cert NZ/MBIE
- District Health Boards (DHBs): Bay of Plenty DHB, Health Alliance/Northern Region DHBs, Health Share Limited (Midland DHBs), Northland DHB, Waikato DHB and Waitemata DHB
- Ministry of Education
- Ministry of Health
- Inland Revenue
- Department of Internal Affairs, including Archives New Zealand and the National Library of New Zealand
- Network for Learning
- New Zealand Trade and Enterprise
- Ministry for Pacific Peoples
- Social Investment Agency
- Ministry of Social Development
- Stats NZ
- Ministry of Youth Development.
Quantitative analysis was completed with Microsoft Excel. Qualitative responses were analysed thematically.
Comparative analysis between the government and community stocktakes was also completed with Microsoft Excel. However, we acknowledge that methodology differences could impact the data. The government initiative stocktake asked respondents to self-identify applicable digital inclusion elements. Conversely, elements were assigned for the community initiative stocktake.
For further information on survey questions, please refer to Appendix B: Survey questions.
Appendix B: Survey questions
Last updated