Digital inclusion and wellbeing in New Zealand
Executive Summary
We examine two main questions relating to internet (and other ICT) access:
- Which groups have a lower likelihood of being digitally included in New Zealand (and why)?
- How does digital inclusion relate to waiora/wellbeing?
In examining the first question, we pay particular attention to the situation for Māori and Pasifika relative to other ethnic groups.
Existing research examines aspects of who is digitally excluded. It is, however, important also to examine how access relates to people’s wellbeing alongside their access and use. Our second question starts to address whether internet access is beneficial for specific communities.
1. Introduction
Advances in information and communications technologies (ICTs), including the internet, have led to advances in life expectancy, GDP, life satisfaction, and environmental sustainability (Bughin et. al. 2019). Access to the internet is fundamental to the effective digitalisation of New Zealand. Accordingly, the New Zealand government has set strategic priorities relating to the digital domain including internet access (Ministry of Business, Innovation & Employment & Stats NZ, 2019).
While there has been prior research on internet access and use in New Zealand (Strickland & Evans 2018, InternetNZ 2017, MBIE 2015, Statistics New Zealand 2018a, Statistics New Zealand 2017, Statistics New Zealand 2018b and Digital Inclusion Research Group 2017), there has been little research examining the relationship between internet access and wellbeing either in New Zealand or globally. According to Bughin et. al. (2019) ICTs (including access to the internet) may be neither good nor bad per se, but ICT access unequally impacts different parts of the population. We provide information both on internet access and use across population segments in New Zealand, and on the relationship between internet use and wellbeing.
Our focus is on two main questions relating to ICT access, with our principal focus being on internet access:
- Which groups have a lower likelihood of being digitally included in New Zealand (and why)?
- How does digital inclusion relate to waiora/wellbeing?
In examining the first of these questions, we pay particular attention to the situation for Māori and Pasifika relative to other ethnic groups.
We draw on a variety of domestic data sources to explore these questions. The most recently surveyed datasets include the New Zealand Crime and Victims Survey (NZCVS, surveyed in 2018) and the New Zealand Electoral Survey (NZES, surveyed in 2017). We also analyse the most recently available dataset relating to adolescents, the Programme for International Student Assessment (PISA, surveyed in 2015). Results of the 2018 PISA survey are scheduled for release in late 2019.
In the Appendix we also present results from the Programme for the International Assessment of Adult Competencies (PIAAC, surveyed in 2014/15). Each survey includes questions about internet access; the NZCVS, PISA and NZES have questions that we use also to examine the relationship between internet access and subjective wellbeing (waiora).
Using this data, we provide information about the digital divide in New Zealand. Our focus is on the difference between those who have internet access and those who do not. We find that Māori, Pasifika, those living in social housing, unemployed people, those not actively seeking work, disabled individuals, those living in larger country towns and older members of society are less likely to have internet access. The largest gaps in internet access are for those who identify as living in social housing, being disabled, unemployed, and/or in older age groups. These findings are broadly consistent across surveys (where similar information is collected).
Using PISA, NZCVS and NZES data, we infer the correlation between subjective wellbeing and internet access (and other forms of digital inclusion). The PISA data indicate that, while internet access is associated with higher subjective wellbeing among students, this effect reduces as more time is spent on the internet. The NZCVS data show that amongst adults, lower life satisfaction is associated with a lower likelihood of internet access. Unlike the PISA data, the NZCVS associations do not control for other characteristics of individuals. For the adult population in NZES, we again find a difference in (a proxy measure of) wellbeing between those with and without internet access when we do not control for other factors, but this relationship disappears once we control for demographic and other influences. However the NZES data show that those with internet access have higher rates of voting in general elections and are much more active in other forms of civic participation than are those without internet access. Thus internet access appears to be positively correlated with these aspects of social capital.
One feature of the NZCVS is that it provides data on which segments of the population are most at risk of having their computer infected by a virus or being otherwise interfered with; we refer to these as occurrences of ‘internet violation’. Māori and Pasifika are more at risk of internet violation than other ethnicities. In addition, people who are disabled, not actively seeking work and/or with low subjective wellbeing having heightened risk of internet violation.
The remainder of this report contains a brief literature review that highlights gaps in existing knowledge, a data section which provides a brief description of the datasets used and relevant questions from those datasets (with further information provided in the Appendix) and a methodology section.
We present our results relating to digital inclusion (principally related to internet access) in section 5 (with further details provided in the Appendix), and our wellbeing-related results are presented in section 6.
A concluding section discusses potential avenues for further research relevant to the promotion of digital inclusion policies in New Zealand.
2. Literature Survey
The literature on internet access in New Zealand deals with topics that include who has access to the internet, the quality of internet connection, how people use their internet and internet security. In this report, we are primarily interested in who has access to the internet and the relationship between internet and wellbeing.
There has been considerable research which looks at the digital divide, both globally and in New Zealand. One category of research looks at the groups in society that make most use of the internet. For example, French, Quinn & Yates (2018) find that education is a predictor of internet use in the UK. Studies have also found a relationship between age and use of the internet; a commonly found result is that internet use diminishes with age, especially for those aged 65 and older (Andrade et. al. 2017, Stephanie 2018, Smith et. al. 2016 and Auckland University of Technology 2018). A related issue, that it is difficult to answer with the data currently at hand, is whether this is an age effect or a cohort effect; for instance, it is conceivable that internet access for people aged over 75 may be commensurate with the rest of the population in one to two decades’ time as the current 50-60 year old age-group moves into later life.
Studies show that New Zealand has a relatively high proportion of people with access to the internet (Strickland & Evans 2018, InternetNZ 2017, MBIE 2015, Statistics New Zealand 2018a, Statistics New Zealand 2017, Statistics New Zealand 2018b and Digital Inclusion Research Group 2017). These studies indicate that further research is nevertheless still required to look at the relationship between internet connection and certain demographics, for instance the rural vs urban divide and internet access according to disability status. We provide a more in depth demographic breakdown here, using the demographic groups available in PISA, NZES, NZCVS and PIAAC.
One issue of policy interest for which data has been somewhat lacking in recent studies is analysis of internet access for Māori, Pasifika and other ethnic groups in New Zealand. A study by MBIE (2015) found that internet access for Māori was lower than for other groups in New Zealand, mirroring a prior finding by Greenbrook-Held & Morrison (2011) who also found low access rates for Pasifika.
Bughin et. al. (2019) examined the relationship between technology and wellbeing globally, highlighting the many benefits of access to the internet and other aspects of ICTs. One more cautionary study relating to adolescents in England is that by Przybylski and Weinstein (2017). They show that while a small amount of screen use (such as use of the internet) is associated with improved mental health, screen use of longer than one to two hours is associated with poorer adolescent mental health outcomes. There is little or no research exploring similar relationships in New Zealand. Indeed, perhaps the biggest gap in the internet-related literature for New Zealand is analysis of the relationship between internet access and wellbeing.
This report aims to close the gaps in the literature with regard to how internet access varies across demographic groups. We also provide evidence of the relationship between wellbeing, internet access and intensity of internet access in New Zealand. Related to wellbeing issues, we present new findings on the groups within society that are most at risk of internet crime, an area that has hitherto been understudied both in New Zealand and globally.
3. Data
The surveys primarily used for this analysis include the Programme for International Student Assessment (PISA, 2015), the New Zealand Electoral Survey (NZES, 2017) and the New Zealand Crime and Victim Survey (NZCVS, 2018). Each survey includes questions about internet access and each has questions that enable us to examine correlations of internet access with subjective wellbeing. In the Appendix, we also discuss the (more dated) Programme for the International Assessment of Adult Competencies (PIAAC, 2014) survey.
In this section, we briefly outline the three main surveys used. The Appendix provides further details on the survey questions used from each of these surveys.
4. Methodology
Methodology applied to the data:
5. Results: Internet Access
PISA
We use the PISA data to examine internet access of 15-year olds in terms of time spent online at school and at home, plus internet access at school and at home. We break the statistics down by gender and ethnicity using sampling weights. Recall that the data refer to 2015, so some patterns may have changed in the interim.
Table 1 and Table 2 show access to the internet broken down by gender. We find a reported gender difference in access at school with males (76.54%) reporting less access than females (81.45%). There is little difference in access at home. Similarly, there is little difference between males and females in terms of time spent on internet outside of school. The notable difference is for time spent on the internet at school, with 80% of females, compared with 74% of males, spending time on the internet (see Table 3, Table 4, and Table 5).
Total numbers in all PISA and NZES tables are after applying sampling weights.
| Yes and use it | Yes but don't use it | No | No response | Total | |
|---|---|---|---|---|---|
| Female | 85.99% | 1.04% | 0.89% | 12.08% | 26,966 |
| Male | 84.60% | 1.04% | 1.22% | 13.14% | 27,309 |
| Total | 85.29% | 1.04% | 1.06% | 12.62% | 54,274 |
| Yes and use it | Yes but don't use it | No | No response | Total | |
|---|---|---|---|---|---|
| Female | 81.45% | 4.49% | 0.86% | 13.20% | 26,966 |
| Male | 76.54% | 6.59% | 1.95% | 14.92% | 27,309 |
| Total | 78.98% | 5.55% | 1.41% | 14.07% | 54,274 |
| No time | Time spent | No response | Total | |
|---|---|---|---|---|
|
Female |
5.61% |
80.02% |
14.37% |
26,966 |
|
Male |
10.08% |
73.91% |
16.01% |
27,309 |
|
Total |
7.86% |
76.94% |
15.20% |
54,274 |
| No time | Time spent | No response | Total | |
|---|---|---|---|---|
|
Female |
1.92% |
83.77% |
14.31% |
26,966 |
|
Male |
1.77% |
82.35% |
15.87% |
27,309 |
|
Total |
1.85% |
83.06% |
15.10% |
54,274 |
| No time | Time spent | No response | Total | |
|---|---|---|---|---|
|
Female |
1.94% |
83.19% |
14.87% |
26,966 |
|
Male |
1.65% |
81.98% |
16.37% |
27,309 |
|
Total |
1.79% |
82.58% |
15.62% |
54,274 |
Table 6 and Table 7 report internet access at school and outside of school, broken down by ethnicity. Table 6 shows internet access at home. Pasifika students report far lower internet access rates at home (74%) than do students of all other ethnicities; Pākehā students have the highest rate of home access, approximately 6 percentage points higher than the Māori access rate. Those of “unknown” ethnicities appear to have an extraordinarily high “no response” to the internet questions. These are likely to be students who answer the survey questions incompletely and so are not discussed here.
Similarly, Pasifika students report much lower internet access at school than do other students (although the high “no response” rate for Pasifika students may influence the Pasifika results). Again Māori students lag Pākehā students in this respect, lagging by nine percentage points in school internet use. The lagging rates of particularly Pasifika internet access (and, to a lesser but still material extent, Māori access) at school – if reported accurately – is of special concern given these students’ comparative lack of internet access at home.
| Yes and use it | Yes but don't use it | No | No response | Total | |
|---|---|---|---|---|---|
|
Māori |
85.05% |
1.65% |
3.98% |
9.31% |
4,215 |
|
Pasifika |
71.62% |
2.36% |
1.58% |
24.45% |
3,545 |
|
Asian |
85.25% |
0.41% |
0.44% |
13.90% |
6,492 |
|
Pākehā |
90.98% |
0.86% |
0.75% |
7.42% |
28,901 |
|
Māori and Pākehā |
88.98% |
1.20% |
0.93% |
8.89% |
4,391 |
|
Other |
79.95% |
0.00% |
0.00% |
20.05% |
680 |
|
All other combinations |
80.18% |
1.80% |
1.38% |
16.65% |
4,675 |
|
Unknown |
10.02% |
0.00% |
0.00% |
89.98% |
1,373 |
|
Total |
85.29% |
1.04% |
1.06% |
12.62% |
54,274 |
| Yes and use it | Yes but don't use it | No | No response | Total | |
|---|---|---|---|---|---|
|
Māori |
75.42% |
6.72% |
3.69% |
14.17% |
4,215 |
|
Pasifika |
66.40% |
5.87% |
1.24% |
26.49% |
3,545 |
|
Asian |
78.63% |
4.47% |
1.75% |
15.16% |
6,492 |
|
Pākehā |
84.60% |
5.76% |
1.25% |
8.39% |
28,901 |
|
Māori and Pākehā |
82.35% |
5.72% |
1.15% |
10.78% |
4,391 |
|
Other |
73.09% |
4.73% |
0.00% |
22.18% |
680 |
|
All other combinations |
75.73% |
5.68% |
0.85% |
17.74% |
4,675 |
|
Unknown |
8.98% |
1.04% |
0.00% |
89.98% |
1,373 |
|
Total |
78.98% |
5.55% |
1.41% |
14.06% |
54,274 |
When we examine the amount of time spent on the internet (Table 8, Table 9, and Table 10), we observe the same patterns. Pasifika students are much less likely to report spending any time on the internet both at school and at home (on weekdays and weekends) than do students of other ethnicities. Māori students lag Pākehā students in spending any time on the internet whether at school or at home, with the gaps between use rates being about seven percentage points in each case.
| Time spent | No time spent | No response | Total | |
|---|---|---|---|---|
|
Māori |
75.12% |
9.83% |
15.05% |
4,215 |
|
Pasifika |
58.71% |
10.16% |
31.13% |
3,545 |
|
Asian |
76.55% |
8.42% |
15.03% |
6,492 |
|
Pākehā |
82.93% |
7.78% |
9.29% |
28,901 |
|
Māori and Pākehā |
80.11% |
7.97% |
11.92% |
4,391 |
|
Other |
69.42% |
4.06% |
26.52% |
680 |
|
All other combinations |
74.20% |
6.35% |
19.45% |
4,675 |
|
Unknown |
8.31% |
1.71% |
89.98% |
1,373 |
|
Total |
76.94% |
7.86% |
15.20% |
54,274 |
| Time spent | No time spent | No response | Total | |
|---|---|---|---|---|
|
Māori |
82.62% |
1.66% |
15.72% |
4,215 |
|
Pasifika |
66.08% |
3.34% |
30.58% |
3,545 |
|
Asian |
83.62% |
1.09% |
15.29% |
6,492 |
|
Pākehā |
89.33% |
1.45% |
9.22% |
28,901 |
|
Māori and Pākehā |
85.20% |
3.20% |
11.60% |
4,391 |
|
Other |
75.70% |
1.32% |
22.98% |
680 |
|
All other combinations |
77.10% |
3.70% |
19.20% |
4,675 |
|
Unknown |
10.65% |
0.00% |
89.35% |
1,373 |
|
Total |
83.06% |
1.85% |
15.10% |
54,274 |
| Time spent | No time spent | No response | Total | |
|---|---|---|---|---|
|
Māori |
82.18% |
1.70% |
16.12% |
4,215 |
|
Pasifika |
64.76% |
3.97% |
31.26% |
3,545 |
|
Asian |
82.82% |
1.08% |
16.10% |
6,492 |
|
Pākehā |
88.98% |
1.41% |
9.62% |
28,901 |
|
Māori and Pākehā |
85.58% |
2.72% |
11.70% |
4,391 |
|
Other |
74.19% |
1.32% |
24.49% |
680 |
|
All other combinations |
76.71% |
3.36% |
19.93% |
4,675 |
|
Unknown |
8.61% |
0.00% |
91.39% |
1,373 |
|
Total |
82.58% |
1.80% |
15.62% |
54,274 |
In the Appendix, we report additional tables using the PISA data relating to the amount of time spent on the internet per day by students (according to gender and ethnicity). As with the tables in this section, we include separate tables for internet use at school, internet use outside of school on weekdays, and internet use per day on weekends. Of those who responded, approximately 38% of students use the internet for at least four hours per weekday outside of school, while 51% of students use the internet for at least four hours per weekend day. In each case, females are slightly more likely than males to be using the internet for these prolonged periods per day.
In terms of ethnicity, one feature that stands out is that internet use outside of school for over six hours per day (on weekdays and weekends) is most predominant amongst Māori students: 27% of Māori students report using the internet outside of school on weekdays for over six hours per day, with this rate rising to 32% on weekends. We have no information on what types of material are being accessed by these prolonged internet users, and further research on the internet use of prolonged users is warranted.
NZES
Table 11 to Table 18 report descriptive statistics for different demographic groups and their internet access using 2017 NZES data. The definition of internet access for this dataset is whether an individual ticked yes to one or more of: having access to the internet at work, having access to the internet at home, having access to the internet on mobile or having access to the internet somewhere else, without ticking yes to having no access to the internet. The no internet category is applied to individuals who ticked no access to the internet and did not tick yes to any form of internet access. All data were weighted using the sample weights provided by NZES.
Total numbers in all PISA and NZES tables are after applying sampling weights.
Ethnicity and access to the internet
Table 11 shows the breakdown of access to the internet in 2017 by ethnicity. It shows that, of the identified ethnicities, Māori (12.23%) and Pasifika (10.55%) are the most likely not to have internet access.
| Ethnicity | No Internet | Internet | Unknown | Total |
|---|---|---|---|---|
|
European |
8.89% |
90.49% |
0.61% |
2,609 |
|
Māori |
12.23% |
87.13% |
0.64% |
336 |
|
Pasifika |
10.55% |
89.45% |
0.00% |
81 |
|
Asian |
2.67% |
97.33% |
0.00% |
199 |
|
Other |
13.34% |
86.66% |
0.00% |
18 |
|
No Response |
10.43% |
87.74% |
1.83% |
203 |
|
Total |
9.00% |
90.36% |
0.64% |
3,445 |
Gender and access to the internet
In Table 12 we see that there is little disparity between males and females. Those who identified as gender diverse (and those who did not identify their gender) have a much higher proportion without access to the internet (22.11% and 18.59% respectively) but the number of individuals in these groups is low (7 and 81 respectively).
| Gender | No Internet | Internet | Unknown | Total |
|---|---|---|---|---|
|
Male |
8.45% |
91.10% |
0.45% |
1,636 |
|
Female |
9.00% |
90.27% |
0.73% |
1,721 |
|
Gender diverse |
22.11% |
77.89% |
0.00% |
7 |
|
Non response |
18.59% |
78.49% |
2.92% |
81 |
|
Total |
9.00% |
90.36% |
0.64% |
3,445 |
Age and access to the internet
Table 13 reports access to the internet broken down by age. Access to the internet decreases as the age group gets older, sharply so beyond age 65. By comparison with the youngest cohort (which has over 99% access) over 35% of those who are over 75 years old have no internet access.
| Age | Internet | No internet | Unknown | Total |
|---|---|---|---|---|
|
<26 |
99.17% |
0.18% |
0.65% |
425 |
|
26-45 |
96.33% |
3.67% |
0.00% |
1,053 |
|
46-65 |
92.33% |
7.06% |
0.61% |
1,146 |
|
66-75 |
85.68% |
13.88% |
0.44% |
487 |
|
>75 |
60.34% |
36.54% |
3.12% |
334 |
|
Total |
90.36% |
9.00% |
0.64% |
3,445 |
Education level and access to the internet
Table 14 reports access to the internet, broken down by education level. It shows a trend that the higher qualification an individual has, the more likely it is that they will have internet access. Those with no qualification have the lowest proportion of individuals with access to the internet at 72.50%. This result may be partly explained by age since individuals in the oldest cohorts have fewer qualifications than those in younger cohorts. All groups with university level qualifications have at least 98% of individuals with access to the internet.
| Education | No Internet | Internet | Unknown | Total |
|---|---|---|---|---|
|
No Qualification |
25.61% |
72.50% |
1.89% |
636 |
|
School Certificate/Level 1 |
14.36% |
85.33% |
0.31% |
333 |
|
Sixth Form Certificate Level 2 |
1.99% |
98.01% |
0.00% |
200 |
|
University Entrance |
3.51% |
96.49% |
0.00% |
130 |
|
Higher School Certificate |
2.56% |
97.44% |
0.00% |
73 |
|
University Entrance Bursary |
15.43% |
84.57% |
0.00% |
91 |
|
Bursary or School Level 3 |
0.09% |
99.91% |
0.00% |
124 |
|
Another secondary qualification New Zealand |
25.34% |
74.45% |
0.20% |
55 |
|
Another secondary qualification overseas |
2.64% |
97.36% |
0.00% |
111 |
|
No Response |
21.36% |
76.84% |
1.80% |
131 |
|
National Certificate Level 4 post school |
4.48% |
94.55% |
0.97% |
357 |
|
Poly Tech |
3.08% |
96.26% |
0.66% |
333 |
|
Undergrad |
0.31% |
99.56% |
0.14% |
559 |
|
Masters Hons |
0.67% |
99.33% |
0.00% |
271 |
|
Doctorate |
0.00% |
98.94% |
1.06% |
41 |
|
Total |
9.00% |
90.36% |
0.64% |
3,445 |
Position inside or outside the workforce and access to the internet
In Table 15, we show access to the internet broken down by work situation. Those working full time (98.07%) and those studying at university or at another institution (98.86%) have the highest proportions of people with access to the internet. Surprisingly, those who are self-employed have a lower proportion with access to the internet (91.74%) than those who are employed full-time or part-time. Those who are retired (74.65%) and the disabled (71.17%) have the least access.
| Job | No Internet | Internet | Unknown | Total |
|---|---|---|---|---|
|
Working full time |
1.69% |
98.07% |
0.24% |
1,568 |
|
Working part time |
5.66% |
94.16% |
0.18% |
555 |
|
Self-employed |
7.83% |
91.74% |
0.44% |
564 |
|
Unemployed |
11.55% |
88.38% |
0.06% |
146 |
|
Retired |
24.19% |
74.65% |
1.17% |
728 |
|
Disabled |
27.30% |
71.17% |
1.52% |
141 |
|
At school or university |
0.66% |
98.86% |
0.48% |
210 |
|
Working unpaid outside the home |
6.37% |
92.85% |
0.77% |
90 |
|
Working unpaid inside the home |
4.59% |
94.47% |
0.94% |
167 |
|
Total |
8.47% |
92.55% |
0.51% |
4,107 |
Area residing in and internet access
In Table 16, we report access to the internet broken down by the type of area in which an individual resides. Those living in a major city, defined as a place which has more than 100,000 people, have the highest proportion of people with access to the internet (92.73%). While it might be expected that those in a rural area or settlement would have the lowest proportion of people with access to the internet, it is those in larger country towns (10,000-25,000 population) who have the lowest proportion (87.44%).
| Area residing in | Internet | No Internet | Unknown | Total |
|---|---|---|---|---|
|
Rural area or settlement (under 10,000 population) |
90.39% |
8.25% |
1.36% |
486 |
|
Country town (under 10,000 population) |
88.59% |
10.85% |
0.56% |
394 |
|
Larger country town (10,000-25,000 population) |
87.44% |
12.16% |
0.40% |
274 |
|
Large town (over 25,000 population) |
90.46% |
9.33% |
0.22% |
603 |
|
Major city (over 100,000 population) |
92.73% |
6.74% |
0.53% |
1,563 |
|
Total |
91.03% |
8.38% |
0.60% |
3,321 |
Housing situation and internet access
Access to the internet broken down by housing situation is reported in Table 17. Those who rent a house or flat from HNZC or the local (social housing) equivalent have the lowest proportion of people with internet access (69.36%). This is considerably lower than the other categories. By contrast, those who own a house or flat with a mortgage have the highest proportion with access to the internet (96.17%).
| Housing situation | Internet | No internet | Unknown | Total |
|---|---|---|---|---|
|
Own a house or flat mortgage free |
87.12% |
12.12% |
0.75% |
1,144 |
|
Own a house or flat with a mortgage |
96.17% |
3.45% |
0.38% |
950 |
|
Rent a house privately as a family |
94.07% |
5.61% |
0.31% |
407 |
|
Rent a house or flat from HNZC or local equivalent |
69.36% |
30.15% |
0.49% |
124 |
|
Board or live in a hotel, hostel, rest home, or temporary |
80.69% |
15.17% |
4.14% |
92 |
|
Rent a house with a group of individuals |
91.92% |
8.08% |
0.00% |
170 |
|
Live with parents or other family members |
94.17% |
5.50% |
0.33% |
414 |
|
Total |
90.88% |
8.54% |
0.58% |
3,302 |
Voting, civic participation and internet access
Tables 18a, 18b and 18c show the engagement of people with and without internet access in terms of voting behaviour (in each of general and local government elections) and other forms of civic participation (defined as one or more of: signing a petition, making a select committee submission, making a royal committee submission or consulting with government).
Each of these activities can be considered as separate social capital outcomes. People with internet have a higher turnout in general (but not local) elections than people without internet, and are much more likely to engage in other forms of civic participation.
These results do not control for other characteristics of the individual. In section 6, we further investigate the relationship between internet access and these social capital outcomes, and also examine the relationship of internet access with generalised dissatisfaction of an individual.
| Internet | No internet | |
|---|---|---|
|
Cast a vote |
83.36% |
73.36% |
|
Chose not to cast a vote |
8.64% |
12.14% |
|
Didn't manage to vote |
5.74% |
8.50% |
|
No Response |
2.25% |
6.00% |
|
Total |
100% |
100% |
| Internet | No internet | |
|---|---|---|
|
Voted |
49.81% |
51.27% |
|
Did not vote |
31.25% |
27.90% |
|
Don’t know or can’t remember |
18.95% |
20.83% |
|
Total |
100% |
100% |
| Internet | No internet | |
|---|---|---|
|
Yes |
40.34% |
19.21% |
|
No |
51.78% |
62.29% |
|
Unknown |
7.88% |
18.50% |
|
Total |
100% |
100% |
We provide extra information, based on the longitudinal NZES information for 2011, 2014 and 2017 in the Appendix. Table A14 reports the pattern of internet access for individuals who are observed in each wave of the longitudinal sample. It shows considerable persistence in internet access, so that once an individual gains access, they are very likely to retain access. A small portion of respondents lose access in one or more waves. More common is a rump of respondents who have never had internet access. This group comprises 8.5% of the sample (using 2017 sample weights).
Other Appendix tables detail internet access in 2011, 2014 and 2017 based on work situation, ethnicity and age. For ethnicity, we base the categories on the 2011 information (i.e. their ethnicity in 2011), while for work situation and age we report access based on their current status. (Note there are small numbers for some categories, and in these cases the proportions of people having internet access should be ignored.)
Notable points from the Appendix tables include part-time workers substantially increasing internet access from 2011 to 2014 (and further again in 2017). The work situation table shows an increase followed by a decrease in internet access of retirees over the period. When we examine the same issue by age, we find a steady increase in internet access for the 66-75 year age group, while the over 75 year age group records an increase and then a decrease in internet access over the two intervals (2011-2014 followed by 2014-2017).
NZCVS
Table 19 to Table 24 provide descriptive statistics for different demographic groups and their internet access using 2018 NZCVS data. As part of the response to the question: ‘In the last 12 months, has a computer or internet-enabled device belonging to you or anyone else living in your household, been infected or interfered with, for example by a virus or someone accessing it without permissions?’ there is a possible response of ‘Not applicable – Nobody in this household has owned a computer or Internet-enabled device in the last 12 months’. This category is used here to represent those who do not have access to the internet. The results for this question are shown for a variety of demographic groups. All data were randomly rounded to base three using rules defined by Statistics NZ.
Each of the NZCVS tables presents three categories (plus ‘don’t knows’). The third group in each table reports those having no internet access over the previous 12 months. This corresponds to our no internet access groups for NZES and PISA. The first group in each table is also of policy interest: this group reports having had an internet-related violation such as a virus infection or unauthorised access over the past year.
Ethnicity and internet issue
Table 19 shows responses broken down by ethnicity. The highest proportion of individuals who do not have access to the internet are those who identify as Pasifika (7.9%). By contrast Māori and Europeans report very similar internet access. Māori and Pasifika are the most likely to report an internet violation.
| Ethnicity | Violation: Yes | Violation: No | No internet | Don't Know | Total |
|---|---|---|---|---|---|
|
European |
3.9% |
90.2% |
5.4% |
0.6% |
5,442 |
|
Māori |
5.3% |
89.2% |
5.0% |
0.5% |
2,304 |
|
Pasifika |
5.1% |
86.9% |
7.9% |
0.2% |
492 |
|
Asian |
2.4% |
95.8% |
1.2% |
0.7% |
759 |
|
Other |
1.6% |
94.4% |
2.4% |
1.6% |
126 |
|
Total |
4.1% |
90.4% |
5.0% |
0.6% |
9,123 |
Note: In all NZCVS tables, no internet means nobody in the household has owned a computer or internet-enabled device in the last 12 months. To ensure confidentiality all cells are random rounded to base three using the rules defined by Stats NZ.
Sex and internet issue
In Table 20, we show responses broken down by sex. The results show no gender divide for internet access with males and females having the same proportion of individuals without access to the internet (5.4%). Males and females also show the same rate of internet violation over the year.
| Sex | Violation: Yes | Violation: No | No internet | Don't Know | Total |
|---|---|---|---|---|---|
|
Female |
3.9% |
90.2% |
5.4% |
0.6% |
4,608 |
|
Male |
3.9% |
90.2% |
5.4% |
0.6% |
3,423 |
|
Total |
3.9% |
90.2% |
5.4% |
0.6% |
8,031 |
Age and internet issue
Responses according to age are reported in Table 21. Consistent with NZES, as age increases, the proportion of those without access to the internet increases. For example, 0.9% of 15 to 19 year olds do not have access to the internet whereas 15.8% of those 65 years have no internet access. There is no clear trend in rates of internet violation by age, although there may be some need to ensure that the youngest users (with a comparatively high 5.1% violation rate) are made fully aware of the risks that may arise from internet use.
| Age groups | Violation: Yes | Violation: No | No internet | Don't Know | Total |
|---|---|---|---|---|---|
|
15-19 Years |
5.1% |
93.7% |
0.9% |
0.3% |
333 |
|
20-29 Years |
3.2% |
94.4% |
2.0% |
0.4% |
1,176 |
|
30-39 Years |
4.0% |
94.0% |
1.3% |
0.8% |
1,410 |
|
40-49 Years |
5.8% |
91.1% |
2.4% |
0.7% |
1,353 |
|
50-59 Years |
4.1% |
92.5% |
3.0% |
0.4% |
1,407 |
|
60-64 Years |
3.4% |
89.6% |
6.1% |
1.0% |
624 |
|
65 Years and Over |
2.4% |
81.2% |
15.8% |
0.6% |
1,725 |
|
Total |
3.9% |
90.2% |
5.4% |
0.7% |
8,028 |
Household income and internet issue
Table 22 shows responses according to household income (similar results are found when using personal income in place of household income). As household income increases above $20,000, the proportion of people with access to the internet increases. The group with the highest proportion of people without access to the internet is the $10,001 to $20,000 a year group (21.1%). This group may include substantial numbers of single older New Zealanders as the single rate of New Zealand Superannuation is just below $20,000 p.a. It is also likely to include a substantial number of beneficiaries under the age of 65 (for instance, the annual net rate of unemployment benefit for a single parent with children is less than $15,000 p.a.).
| Household income | Violation: Yes | Violation: No | No internet | Don't Know | Total |
|---|---|---|---|---|---|
|
$10,000 or less |
4.5% |
91.9% |
2.8% |
0.8% |
357 |
|
$10,001-$20,000 |
4.4% |
73.8% |
21.1% |
0.6% |
474 |
|
$20,001-$30,000 |
3.4% |
81.7% |
14.4% |
0.6% |
1,017 |
|
$30,001-$40,000 |
3.2% |
87.7% |
8.5% |
0.7% |
744 |
|
$40,001-$50,000 |
4.3% |
90.1% |
5.2% |
0.4% |
699 |
|
$50,001-$60,000 |
4.0% |
92.5% |
2.7% |
0.9% |
702 |
|
$60,001-$70,000 |
4.0% |
92.1% |
3.2% |
0.7% |
696 |
|
$70,001-$100,000 |
3.2% |
94.5% |
1.6% |
0.7% |
1,299 |
|
$100,001-$150,000 |
3.9% |
94.8% |
0.8% |
0.5% |
1,230 |
|
$150,001 or more |
4.8% |
94.5% |
0.4% |
0.4% |
810 |
|
Total |
3.9% |
90.3% |
5.4% |
0.6% |
8,028 |
Employment status and internet issue
Table 23 reports responses according to employment status. The group with the highest proportion of people without access to the internet are those who are retired (17.3%) and those not actively seeking work (16.6%). These proportions are much higher than for those who are unemployed (5.2%). By contrast, only 1.0% of those studying and 1.9% of those employed do not have access to the internet. Those who are not actively seeking work are most at risk of an internet violation (7.3%) followed by people who are unemployed (5.7%). Consistent with the age results, people who are studying are also at heightened risk of internet violation (5.2%).
| Employment status | Violation: Yes | Violation: No | No internet | Don't Know | Total |
|---|---|---|---|---|---|
|
Employed |
4.0% |
93.7% |
1.9% |
0.5% |
4,986 |
|
Unemployed |
5.7% |
88.0% |
5.2% |
1.1% |
369 |
|
NILF - Retired |
2.5% |
79.5% |
17.3% |
0.8% |
1,431 |
|
NILF - Home or caring duties |
2.6% |
91.6% |
4.5% |
1.3% |
465 |
|
NILF - Studying |
5.2% |
93.9% |
1.0% |
0.0% |
309 |
|
NILF - Not actively seeking work |
7.3% |
74.6% |
16.6% |
1.5% |
204 |
|
Other (not specified) |
4.5% |
89.8% |
5.3% |
0.4% |
246 |
|
Total |
3.9% |
90.2% |
5.4% |
0.6% |
8,010 |
Disability status and internet issue
Table 24 shows responses broken down by disability status. There is a large difference between those who are disabled (17.2%) and those who are not disabled (4.7%) with regards to the proportion of individuals who do not have access to the internet. This is likely to be of policy concern since one might anticipate that disabled people (and especially physically disabled people) could benefit most from internet access. Furthermore, disabled people are more likely than others to have received an internet violation, emphasising their at-risk status with respect to secure internet access.
| Disability status | Violation: Yes | Violation: No | No internet | Don't Know | Total |
|---|---|---|---|---|---|
|
Disabled |
6.7% |
75.2% |
17.2% |
0.5% |
447 |
|
Not disabled |
3.7% |
91.0% |
4.7% |
0.6% |
7,581 |
|
Total |
3.9% |
90.2% |
5.3% |
0.6% |
8,028 |
6. Results: Wellbeing and the Internet
In this section we report relationships between internet access, internet use and indicators of wellbeing. Each of the PISA, NZES and NZCVS surveys are used to shed light on these relationships.
PISA
Table 25a to Table 25g report the results of a regression of the subjective wellbeing (SWB) proxy variable against internet access, other ICT variables and demographic variables. The demographic variables which are included in the equation are not reported; they are available on request.
The coefficients should not be used to indicate causal relationships; rather they demonstrate associations of wellbeing with internet use and availability. The results indicate that students who have use of a desktop at home, laptop at home, tablet at home or wireless internet at school are better off in terms of wellbeing than are those who do not have these items. Similarly, those who access the internet outside of school on weekdays have higher wellbeing relative to those who do not. These results may reflect family circumstances rather than ICT access per se.
Potentially of more policy interest is the finding that the positive relationship between wellbeing and internet access outside of school on weekdays declines monotonically the more time an individual spends online during a week day outside of school (see Tables). No significant relationship is found between SWB and time spent on the internet outside of school on weekends or at school on weekdays.
The results relating to internet use at home on weekdays (for those who have internet access) suggest that while access to the internet may be beneficial, the beneficial association declines as students spend longer online (see Figure 1 below). Our results indicate no beneficial association once students are online for over two hours per weekday outside of school (and no benefits of use on weekends). These results are similar to the results relating to overall screen-time use for UK adolescents reported by Przybylski and Weinstein (2017).
Note: For internet use at home on weekdays, we do not reject the null hypothesis of equal coefficients for 1-30 minutes per day and 31-60 minutes per day (p=0.5824), 1-2 hours per day (p=0.1315) and unknown time per day (p=0.4922); we conclusively reject equal coefficients for 1-30 minutes per day and each of the longer usage periods (p=0.0202, p=0.0012 and p<0.001 respectively).
Our findings may suggest that students limit their time spent on the internet outside of school on weekdays to less than two hours. In this light, it is worth highlighting the actual time that students report spending on the internet each day. These results are shown in the Appendix Table A9. Approximately 15% of 15 year olds (including 27% of Māori students) report using the internet for more than 6 hours a day (on a weekday outside of school), while over half report more than two hours’ use.
Figure 1: Relationship between subjective wellbeing and time spent on internet outside of school on weekdays.
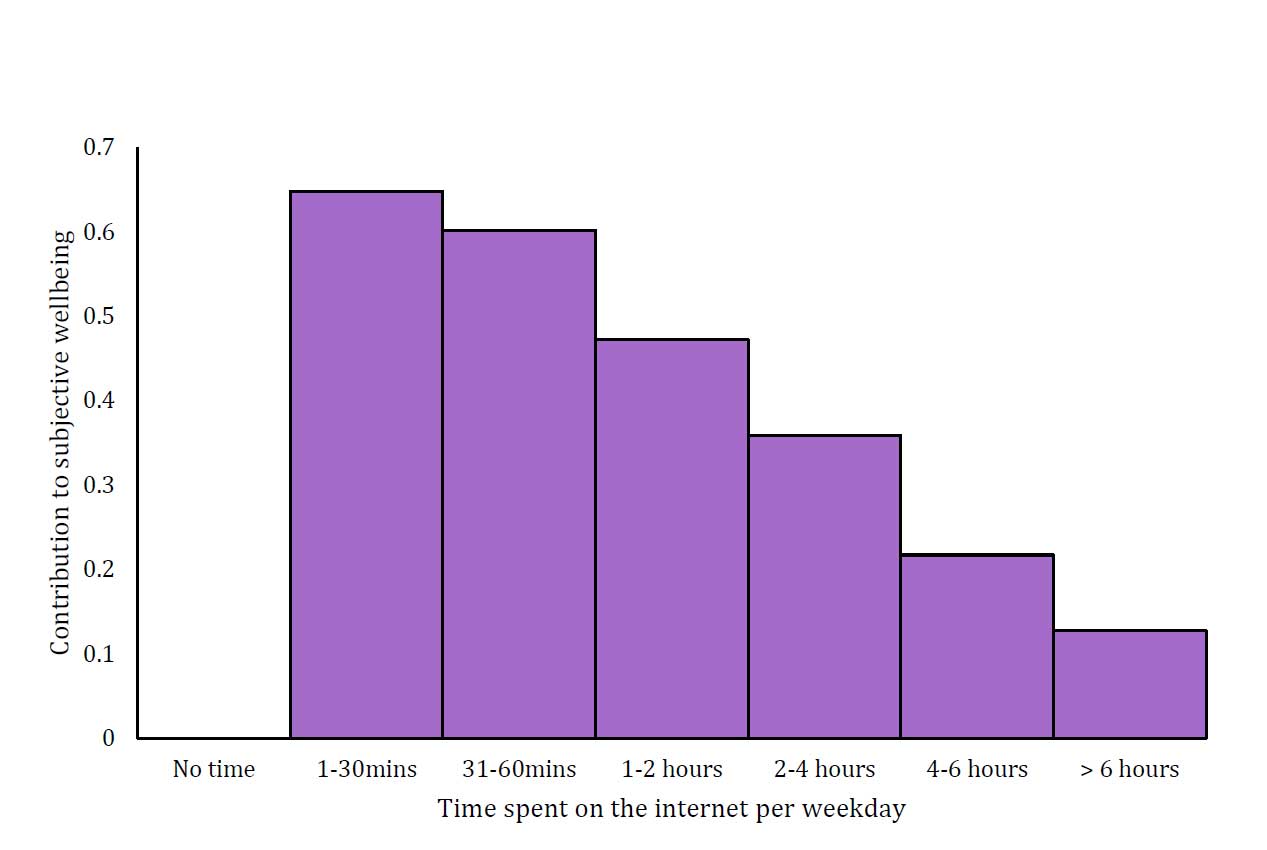
Read detailed description of Figure 1
This bar graph shows how time spent on the internet per weekday contributes to subjective wellbeing. The graph suggests that that while access to the internet may be beneficial, the beneficial association declines as students spend longer online.
|
Time spent on internet at home weekdays (base category = no time spent) |
Coefficient (standard error) |
|---|---|
|
1-30 minutes per day |
0.674** (0.199) |
|
31-60 minutes per day |
0.601** (0.194) |
|
1-2 hours per day |
0.472* (0.193) |
|
2-4 hours per day |
0.358 (0.194) |
|
4-6 hours per day |
0.217 (0.197) |
|
Over 6 hours per day |
0.128 (0.202) |
|
Unknown |
0.447 (0.356) |
The relationship between wellbeing and internet and ICT access
In the following tables, demographic controls are included (but not reported) for ethnicity, gender, father’s education and mother’s education.
The number of observations used for the regression in the following tables was 4,001. To determine the goodness of fit, we used adjusted R^2. This determines the amount of variation in the wellbeing proxy explained by the variables included, running from 0 to 1. The adjusted R^2 found was 0.0787
As for all other regression tables * p<0.05; ** p<0.01.
| Time spent on internet at school (base category = no time spent) | Coefficient (standard error) |
|---|---|
|
1-30 minutes per day |
-0.030 (0.075) |
|
31-60 minutes per day |
-0.014 (0.078) |
|
1-2 hours per day |
-0.084 (0.081) |
|
2-4 hours per day |
-0.046 (0.089) |
|
4-6 hours per day |
-0.087 (0.109) |
|
Over 6 hours per day |
-0.028 (0.123) |
|
Unknown |
0.030 (0.299) |
| Time spent on internet at home weekdays (base category = no time spent) | Coefficient (standard error) |
|---|---|
|
1-30 minutes per day |
0.674** (0.199) |
|
31-60 minutes per day |
0.601** (0.194) |
|
1-2 hours per day |
0.472* (0.193) |
|
2-4 hours per day |
0.358 (0.194) |
|
4-6 hours per day |
0.217 (0.197) |
|
Over 6 hours per day |
0.128 (0.202) |
|
Unknown |
0.447 (0.356) |
| Time spent on internet at home weekends (base category = no time spent) | Coefficient (standard error) |
|---|---|
|
1-30 minutes per day |
0.109 (0.199) |
|
31-60 minutes per day |
0.242 (0.197) |
|
1-2 hours per day |
0.286 (0.195) |
|
2-4 hours per day |
0.292 (0.195) |
|
4-6 hours per day |
0.246 (0.197) |
|
Over 6 hours per day |
0.197 (0.199) |
|
Unknown |
0.382 (0.296) |
| Variable | Coefficient (standard error) |
|---|---|
|
Available desktop at home which is used |
0.149** (0.040) |
|
Available laptop at home which is used |
0.231** (0.049) |
|
Available tablet at home which is used |
0.080* (0.041) |
|
Available Internet connection at home which is used |
0.069 (0.092) |
|
Available cell phone at home with internet access which is used |
-0.027 (0.042) |
|
Available desktop at school which is used |
0.052 (0.053) |
|
Available laptop at school which is used |
0.046 (0.041) |
|
Available tablet at school which is used |
-0.031 (0.048) |
|
Available computer at school with internet which is used |
-0.058 (0.063) |
|
Available wireless internet connection at school which is used |
0.198** (0.053) |
| Variable | Coefficient (standard error) |
|---|---|
|
Age first used a digital device: 7-9 years old |
-0.018 (0.053) |
|
Age first used a digital device: 10-12 years old |
-0.037 (0.060) |
|
Age first used a digital device: 13 years old or older |
-0.047 (0.090) |
|
Have never used a digital device |
-0.131 (0.335) |
|
Unknown age first used a digital device |
0.405 (0.236) |
| Variable | Coefficient (standard error) |
|---|---|
|
Age first used a computer: 7-9 years old |
-0.020 (0.054) |
|
Age first used a computer: 10-12 years old |
-0.131 (0.078) |
|
Age first used a computer: 13 years old or older |
-0.050 (0.129) |
|
Have never used a computer |
0.194 (0.561) |
|
Unknown age first used a computer |
-0.144 (0.264) |
| Variable | Coefficient (standard error) |
|---|---|
|
Age first used the internet: 7-9 years old |
-0.044 (0.059) |
|
Age first used the internet: 10-12 years old |
-0.016 (0.071) |
|
Age first used the internet: 13 years old or older |
-0.176 (0.116) |
|
Have never used the internet |
-0.746 (0.456) |
|
Unknown age first used the internet |
-0.174 (0.259) |
NZES
The relationship between wellbeing and internet access is investigated using NZES based on a principal component dissatisfaction variable constructed using the process described in our methodology section. We also examine the relationship between wellbeing and three outcome variables related to social capital: whether the respondent voted in the 2017 general election, whether they voted in the 2016 local body elections, and whether they have undertaken some other form of civic participation in the 12 months leading up to the 2017 survey (where civic participation includes signing a petition, making a select committee submission, making a royal committee submission and/or consulting with government).
On average, we find that people without internet access record higher dissatisfaction than do people with internet access (4.152 vs 3.802 respectively). A regression (without other added control variables) of the dissatisfaction variable on internet access shows a significant positive relationship between dissatisfaction and no internet access. However the lack of demographic and other controls means that this raw regression may not provide an accurate picture of the relationship between wellbeing and internet access.
In column 1 of Table 26 we show the results from an OLS regression of the dissatisfaction variable on internet access plus demographic variables. The coefficients indicate associations, and again we cannot draw causal conclusions from them. Demographics controlled for in this regression (but not reported) include gender, working situation, education level, age, income level and ethnicity.
The results indicate that the wellbeing (dissatisfaction) of those who are without internet (and those with unknown internet status) is not different to that of people with internet once we control for demographic and other factors. One possible reason for lack of a clear result here is that the proxy dissatisfaction variable may not be an adequate representation of (a lack of) wellbeing. However the (unreported) results for the demographic controls in the estimated equation are consistent with other SWB findings. For instance: those who identify as Māori are more dissatisfied than those who identify as European, and lower income groups are more dissatisfied than are the highest income groups. These results signal that the principal component variable is likely to be a reasonable measure of dissatisfaction.
Another possible reason for lack of a clear result is that we are testing the relationship between internet access and wellbeing (dissatisfaction). The PISA results suggest that this relationship may depend on the extent of internet access by users, with any positive association between access and wellbeing tailing off sharply as daily internet use increases. We have no measure of intensity of use in the NZES data so our result may reflect an offsetting combination of positive effects for low internet users and negative effects for higher internet users.
Columns 2, 3 and 4 of Table 26 investigate the relationship of internet access with the three social capital outcome variables. In each case, we estimate a logit regression testing whether (lack of) internet access is associated with the social capital outcome. Demographic variables (as above) are included but not reported. Results for the internet variables are reported as odds ratios: a coefficient less than one means that individuals in that category are less likely to engage in the social capital outcome than are other individuals. (The significance test relates to whether the coefficient is different from one.)
We find that those without internet access were (statistically significantly) less likely to vote in the 2017 general election and less likely to be involved in various other forms of civic participation. There is no significant relationship of internet access and voting in the 2016 local body elections. The general election and civic participation results are consistent with the idea that people who are not engaged with others through the internet are also less engaged via more formal aspects of social capital such as civic participation.
Relationship between internet access, wellbeing and social capital indicators
Note: Standard errors are in brackets.
| Variable | Dissatisfaction | GE Vote | LE Vote | Civic Part |
|---|---|---|---|---|
|
No internet access |
0.078 (0.074)
|
0.460* (0.142)
|
1.035 (0.202)
|
0.634** (0.102)
|
|
Internet access unknown |
0.051 (0.229)
|
0.334 (0.265)
|
0.774 (0.420)
|
1.775 (0.843)
|
|
Number of observations |
2,127 |
3,256 |
2,697 |
3,241 |
|
OLS: Adjusted R2 Logit: pseudo R2 |
0.1735 |
0.1411 |
0.0985 |
0.0709 |
NZCVS
Life satisfaction and internet issue
Table 27 reports NZCVS responses broken down by reported life satisfaction (which is measured on a 0 to 10 scale, similar to that used in New Zealand’s General Social Survey). Those with the lowest level of life satisfaction (0-6) have the highest likelihood of no internet access (8.0%). This mirrors the PISA result in which no internet access is associated with lower subjective wellbeing. The rate of internet access appears unrelated to wellbeing for those whose life satisfaction ranges from 7 to 9. Those reporting life satisfaction of 10 have slightly lower rates of internet access, but this association likely reflects age, with retired people generally having high life satisfaction and lower rates of internet access.
It is notable from Table 27 that the rate of internet violations decreases as life satisfaction increases. This suggests that people who are more vulnerable in general (i.e. who have lower life satisfaction) are also those who are more vulnerable to internet violations.
| Life satisfaction | Violation: Yes | Violation: No | No internet | Don't Know | Total |
|---|---|---|---|---|---|
|
0-6 |
5.6% |
85.3% |
8.0% |
1.1% |
1,068 |
|
7 |
4.7% |
89.7% |
4.9% |
0.7% |
1,221 |
|
8 |
3.8% |
91.1% |
4.6% |
0.6% |
2,448 |
|
9 |
3.4% |
91.6% |
4.7% |
0.3% |
1,545 |
|
10 |
2.6% |
91.3% |
5.6% |
0.6% |
1,725 |
|
Total |
3.8% |
90.2% |
5.3% |
0.6% |
8,007 |
7. Conclusions
Our findings relating to internet access and exclusion replicate a number of existing findings for New Zealand. In particular, we find that Pasifika, Māori, those living in larger country towns, and older members of society are comparatively less likely to have internet access.
With respect to older people, the gap in access is much greater for those aged over 75 years than for those aged between 65 and 74 years old. This may suggest that the lack of internet access for those over 75 years is more of a cohort than an age effect – i.e. as the current 65-74 year olds graduate to the over 75 year category, internet access rates may not reduce sharply in the way that is currently observed. Hence a watching brief may be all that is required to monitor internet access rates as people in their sixties continue to age.
We find also that people living in social housing, unemployed people, those not actively seeking work, and disabled individuals are more likely than others to lack internet access. Some people who are unemployed and some who are not actively seeking work may be disengaged from other aspects of society. They are also likely to suffer severe financial constraints, so their lack of internet access is not surprising. Their lack of access may also not be particularly amenable to policy intervention other than by helping these individuals find secure employment.
The very large gaps in internet access for those who live in social housing and for people who identify as being disabled are perhaps the most disturbing. However, these gaps are also potentially amenable to policy interventions.
Most social housing is owned by the state (Housing NZ) or by local authorities or NGOs. In each case, the social housing provider – as opposed to the tenants (who may well suffer from multiple forms of disadvantage) – could take the initiative to install WiFi (or other technologies) to enable internet access by tenants. In the modern age, provision of such infrastructure may be considered similar to provision of water, sewerage and electricity, and may be particularly valuable to marginalised tenants. Such provision may also help to address the lower rates of internet access for Pasifika (and Māori) students.
Many people who are disabled are already subject to some form of care by the authorities (e.g. DHBs) and/or NGOs that deal with specific forms of disability. These authorities may consider enabling internet use for their clients as a key intervention designed to improve the opportunities for disabled people to connect with the rest of society.
Our work examining the connections between internet access, internet use and wellbeing indicate certain associations between internet access and wellbeing – but these associations are not necessarily causal. The NZCVS data indicate that those who do not have internet access tend to have lower wellbeing than those who do have access. The NZES data reveal a similar relationship when we do not control for other factors but that relationship is not found to be present when we control for demographic and other factors. The NZES data do show, however, that those without internet access are less engaged in civic activities such as voting in general elections and in making submissions to government, even after we control for other factors.
Perhaps our most intriguing result with respect to wellbeing concerns the association between subjective wellbeing and internet use by adolescents outside of school on weekdays. This work, based on the PISA data for 15 year olds, controls for other demographic influences. We find that those without internet access tend to have lower wellbeing than those with access (a result which may reflect family circumstances). For those who do access the internet on weekdays outside of school, we find that increases in daily internet use are associated with decreases in levels of wellbeing. Once daily internet use (on weekdays outside of school) exceeds about two hours, we find no positive association of internet use and wellbeing.
Interpretation of this result requires caution because it could, for instance, be that those with poor wellbeing choose to lock themselves away from direct human contact and instead interact with the world through the internet. However, from an intuitive angle, the proportion of youth who report extended internet use on weekdays (outside of school) may well be of concern. We find that 15% of 15 year olds (including 27% of Māori students) report using the internet for more than 6 hours per day on a weekday outside of school, while over half report more than two hours’ use.
We recommend further investigation of the wellbeing effects of such extended use of the internet – both for adolescents and, if the data were available, for children and adults. As always, the issues of causality pose a problem for such research. However, scheduled new surveys offer avenues to address some of these issues. Three recent and scheduled surveys, in particular, offer promise since all three will be linked into Statistics New Zealand’s Integrated Data Infrastructure (IDI) that contains a wealth of information about surveyed individuals to which the relevant surveys can be linked.
The first of these surveys is the 2018 NZCVS – i.e. the survey used here. The responses to this survey are currently being linked into the IDI. Future NZCVS surveys will similarly be linked to the IDI. The second set of surveys are the 2018 and scheduled 2021 PISA surveys. The 2018 survey is expected to be linked into the IDI in early 2020. The third survey is the scheduled PIAAC second cycle survey to be conducted over 2021/22 (with results released in 2023).
By linking these survey results into other (especially prior) characteristics of the surveyed individuals, we will be able to control much better for personal and locational traits that affect both wellbeing and internet (and other ICT) use. While the internet survey data will be cross-sectional, it will be possible to use statistical techniques such as propensity score matching to compare the wellbeing outcomes for otherwise similar individuals who have different internet use and access. From an internet access stance, we will also be able to control much better for geographical and other characteristics when examining the types of people who do not have access. Doing so will enable consideration of more specific policies that are targeted at groups who may benefit from internet use but who do not currently access the internet.
Studies across a wide range of social policies in New Zealand have benefitted from analysis of specific survey data linked into the IDI. We expect that similar benefits will arise from a focused set of studies relating to the internet (and to broader ICT use) using the surveys outlined above.
References
Andrade, D., Hedges, M., Karimikia, H. and Techatassanasoontorn A. 2017. “World Internet Project New Zealand. The internet in New Zealand in 2017.” New Zealand Work Research Institute, Auckland.
Auckland University of Technology. 2018. “Current State of Broadband Usage of Rural Communities in New Zealand.” Rural Broadband Usage Survey Project Team, Auckland.
Bughin, J., Hazan, E., Allas, T., Hjartar, K., Manyika, J., Sjatil, P.E., Shigna, I. 2019. “Tech for Good Smoothing disruption, improving well-being”. McKinsey Global Institute. New York, United States.
Digital Inclusion Research Group. 2017. “Digital New Zealanders: The Pulse of our Nation.” MBIE and DIA, Wellington, New Zealand.
Evans, L., and Strickland, E. Eds. 2018 “Out of the Maze: Building digitally inclusive communities,” SensePublishers, Rotterdam, New Zealand.
French, T., Quinn, L., & Yates, S. 2018. “Digital Motivation : Exploring the reasons people are offline (PDF),” Good Things Foundation, UK.
Greenbrook-Held, J., Morrison, P.S. 2011. “The domestic divide: Access to the Internet in New Zealand” New Zealand Geographer. Volume 67. Pp. 25-38.
InternetNZ 2017 “Solving Digital Divides Together”
MBIE 2015. “Māori me te Ao Hangarau 2015 The Māori ICT Report 2015 (PDF).” He kai kei aku ringa. The Crown- Māori Economic Growth Partnership, Wellington, New Zealand.
Ministry of Business, Innovation & Employment & Stats NZ. 2019. “Digital Nation Domain Plan 2019 (PDF)”. New Zealand Government. Wellington, New Zealand.
Przybylski, A., and Weinstein, N. 2017. “A Large-Scale Test of the Goldilocks Hypothesis: Quantifying the Relations Between Digital-Screen Use and the Mental Well-Being of Adolescents (PDF).” Psychological Science, 28(2), 204-215.
Smith, P., Bell, A., Miller, M., and Crothers, C. 2016. “World Internet Project New Zealand. New Zealand Internet Trends in New Zealand 2007 – 2015” Institute of Culture, Discourse & Communication, Auckland University of Technology.
Statistics New Zealand. 2017 “New Zealand internet going mobile”
Statistics New Zealand. 2018. “Internet-service-provider-survey-2018.” Stats NZ, Wellington, New Zealand.
Statistics New Zealand. 2018. “Stocktake for the digital nation domain plan 2018.” New Zealand Government, Wellington, New Zealand.
Stephanie, D. 2018. “Digital Divide Experiences from the Chatham Islands (PDF),” in Proceedings of the 9th Annual CITRENZ Conference (2018). pp. 22–29.
Appendices
Appendix — PISA data
Appendix — NZES data
Appendix — NZCVS data
Appendix — PIAAC data
The PIAAC survey collects information on cognitive and workplace skills needed within the adult population in over 40 countries.
It is administered every ten years, with the latest information being collected from April 2014 to March 2015.
The survey had a sample size of 6,177 and was administered via a computer with an option for it to be administered by pen and paper.
There are questions on demographics and computer access inside and outside of work which we report here.
We show whether respondents used a computer inside or outside work broken down by demographic group.
The demographic groups include: gender, education level, working status and whether they were self-employed or not; in each case sampling weights are used.
PIACC results
Note: In all PIAAC tables, total numbers are after applying sampling weights.
Appendix — PISA: Additional tables
Appendix — NZES: Longitudinal Tables
Last updated